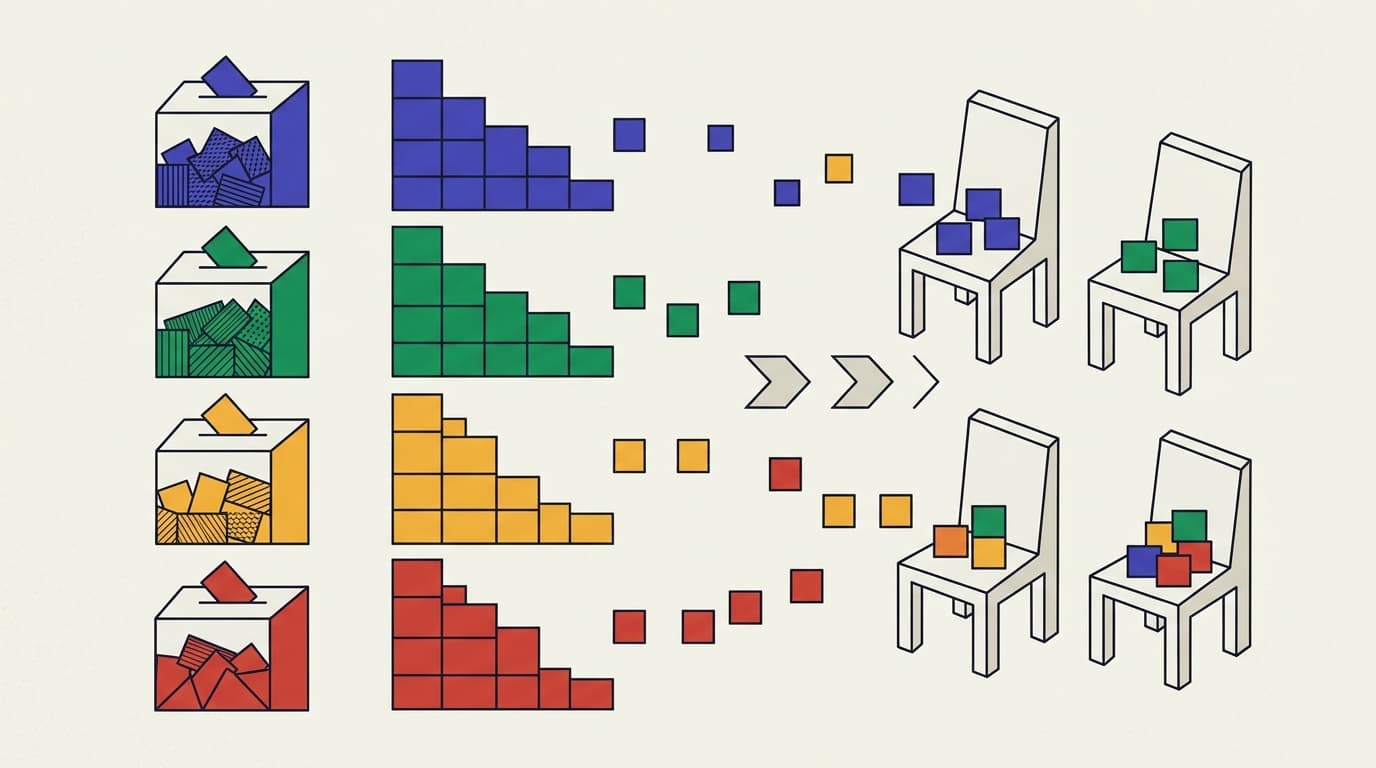
In Belgium, seats are allocated using the D'Hondt method: each list's vote total is divided by 1, 2, 3, 4, then every quotient obtained is ranked from highest to lowest, and the top ones receive a seat until the constituency has none left to give.
The calculation fits on one sheet of paper. It is carried out constituency by constituency, never nationally, which explains a good part of the results that surprise people on election night: a party can gain votes in a province and still lose a seat there, because the bar to clear is not a percentage but the position of a quotient in a ranking shared with the competition.

How is the seat allocation calculated, step by step?
The main constituency office carries out five operations, in this order, as described by the Federal Public Service Home Affairs.
- Establish each list's vote total. Known in Belgium as the chiffre electoral, it is the number of ballots carrying at least one valid vote for that list, whether a head-of-list vote or a preference vote for a main or substitute candidate.
- Remove lists below 5 %. Only lists reaching 5 % of the total valid votes cast in the constituency go through to the next stage. The European Parliament applies no threshold.
- Divide. Each vote total is divided by 1, then by 2, then by 3, and so on.
- Rank and serve. All the quotients, across every list, are ordered from highest to lowest. You keep as many as there are seats to fill. Each quotient kept is worth one seat for its list.
- Underline the last one. The last quotient served becomes the constituency's electoral divisor.
What does the calculation give in a four-seat constituency?
Take a fictional constituency with four seats and 100,000 valid votes, contested by five lists. The 5 % threshold here means 5,000 votes, which all of them clear.
| Divisor | List A (34,000) | List B (28,000) | List C (19,000) | List D (12,000) | List E (7,000) |
|---|---|---|---|---|---|
| ÷ 1 | 34,000 (seat 1) | 28,000 (seat 2) | 19,000 (seat 3) | 12,000 | 7,000 |
| ÷ 2 | 17,000 (seat 4) | 14,000 | 9,500 | 6,000 | 3,500 |
| ÷ 3 | 11,333 | 9,333 | 6,333 | 4,000 | 2,333 |
| ÷ 4 | 8,500 | 7,000 | 4,750 | 3,000 | 1,750 |
Result: two seats for A, one for B, one for C. The electoral divisor is 17,000.
Lists D and E come away empty-handed even though they hold 12 % and 7 % of the vote respectively, well above the legal threshold. The best quotient of D, 12,000, only comes sixth in the overall ranking, behind B's second quotient, while the distribution stops at fourth. Nothing unusual there: a four-seat constituency has only four places, and the second quotient of the strongest list weighs more than the first quotient of a small one.
What is the electoral divisor for?
Checking the calculation in one line. A list's number of seats equals the number of times its vote total contains the electoral divisor: 34,000 divided by 17,000 gives 2, and 12,000 divided by 17,000 gives 0.
The Home Affairs department specifies that the division is not, in principle, carried into fractions. It only is in one case: when the last useful quotient appears on two lists at once, and the decimal left aside can separate them. If the quotients are exactly equal, the seat goes to the list whose candidate concerned has the most votes, and failing that to the older one.
Does the 5 % threshold really change anything?
Far less than people assume, and only in two constituencies out of eleven. The legal threshold sits in article 165bis of the Electoral Code, inserted by the law of 13 December 2002 and applied for the first time at the 2003 election.
The arithmetic already sets its own bar. In a constituency with n seats, a list is certain to win one as soon as it passes 100 divided by (n + 1) per cent of the vote; below that, everything depends on how the remaining votes split. Here is that level for the eleven constituencies of the Chamber of Representatives, with their seat numbers as of the 2024 election.
| Constituency | Seats | Level that guarantees a seat | Legal threshold active? |
|---|---|---|---|
| Antwerp | 24 | 4.0 % | yes |
| East Flanders | 20 | 4.8 % | yes |
| Hainaut | 17 | 5.6 % | no |
| West Flanders | 16 | 5.9 % | no |
| Brussels | 16 | 5.9 % | no |
| Flemish Brabant | 15 | 6.3 % | no |
| Liège | 14 | 6.7 % | no |
| Limburg | 12 | 7.7 % | no |
| Namur | 7 | 12.5 % | no |
| Walloon Brabant | 5 | 16.7 % | no |
| Luxembourg | 4 | 20.0 % | no |
In nine constituencies out of eleven, the division is harsher than the law. In the province of Luxembourg, the smallest in the country with four seats, a list needs to aim for a fifth of the vote to be safe, and the 5 % threshold rules out nobody the calculation would not have ruled out anyway.
Three reading traps on election night
- The national percentage says nothing about the seat count. A list on 8 % spread evenly across eleven constituencies can end up with fewer members than a list on 6 % concentrated in two provinces.
- A lost seat is not necessarily a loss of votes. The number of seats per constituency is recalculated every ten years on population figures: in 2024, Brussels and Namur each gained one, Hainaut and Liège each lost one.
- Blank votes are not redistributed. They count towards the ballots cast, not towards the valid votes used in the calculation, so no list benefits from them.
How does the head-of-list box decide who is elected?
Once the seats are allocated to the lists, it remains to be settled who fills them. The office first calculates the eligibility figure: the list's vote total divided by its number of seats plus one, rounded up. For our list A, that gives 34,000 divided by 3, so 11,334 votes.
Then comes devolution. Ballots on which the voter named no main candidate, including those marked only in the head-of-list box, form a pool of which only half is redistributed, in the order of presentation, to candidates falling short of the eligibility figure. That halving dates from the law of 27 December 2000, whose stated aim was to give preference votes more weight.
Suppose list A has a pool of 5,000 ballots, so 2,500 votes to distribute.
| Candidate | Preference votes | Devolution | Total | Outcome |
|---|---|---|---|---|
| A1 (list leader) | 9,000 | + 2,334 | 11,334 | elected |
| A2 | 13,500 | 0 | 13,500 | elected |
| A3 | 10,900 | + 166 | 11,066 | not elected |
| A4 | 4,200 | 0 | 4,200 | not elected |
Without devolution, A3 and their 10,900 personal votes were ahead of A1 and their 9,000. With it, A1 just reaches the eligibility figure, nearly empties the pool, and takes the second seat. Position on the list still counts, then, twenty-five years after its effect was halved.
Apparentement, limited to two parliaments
Two assemblies add a further stage: the Walloon Parliament and the Parliament of the Brussels-Capital Region. Lists from the same province may group there, an arrangement called apparentement, to recover jointly the seats left unallocated in the first round of calculation, provided they reached at least 33 % of the local electoral divisor in one constituency. The Chamber of Representatives does not use apparentement.
D'Hondt is not the only possible method
Belgium has used it since 1899, on a proposal by the Ghent jurist Victor D'Hondt. Other countries allocate with the Sainte-Laguë method, which divides by 1, 3, 5, 7 instead of 1, 2, 3, 4. Electoral science has long documented the gap between the two families: for the same votes, dividing by successive whole numbers arithmetically favours the strongest lists, while dividing by odd numbers narrows the gap. The choice of method therefore has a measurable effect on the make-up of an assembly, and it rests with the legislature.
To place the parties' positions on institutional reform, the ranking and the comparator give the detail theme by theme; the methodology explains how those positions are collected, and recalls that the published scores describe a position on an axis, never a quality. The difference between Regions and Communities sheds light, for its part, on which assembly decides what.
Sources: Federal Public Service Home Affairs, counting, seat allocation and designation of the elected and Chamber of Representatives; Electoral Code, article 165bis, inserted by the law of 13 December 2002; law of 27 December 2000 halving the devolutive effect of the head-of-list box; Belgian Senate, electoral system; Belga and RTBF, Chamber seat distribution for the 2024 election; D'Hondt method. The worked figures in this article are demonstration calculations, redone step by step under the official rules.
Institutions comparator
Compare the parties' positions on institutions.
Compare now →
Frequently asked questions
Camille est politologue, diplômée en sciences politiques de l'UCLouvain. Elle a suivi trois campagnes électorales belges comme analyste et décortique depuis dix ans les programmes des partis, vote par vote. Sur Meilleur Parti Politique, elle traduit le jargon politique en comparaisons concrètes — sans jamais dire pour qui voter.